
Kitchen charts that answer the question in front of you.
Four charts, each with its own tabs: conversions, cooking, substitutions and shelf life. They give the number you need and the reason it is that number, and the first column stays put while you scroll.
 Free. No account, no limit, no ads, and no signal needed.
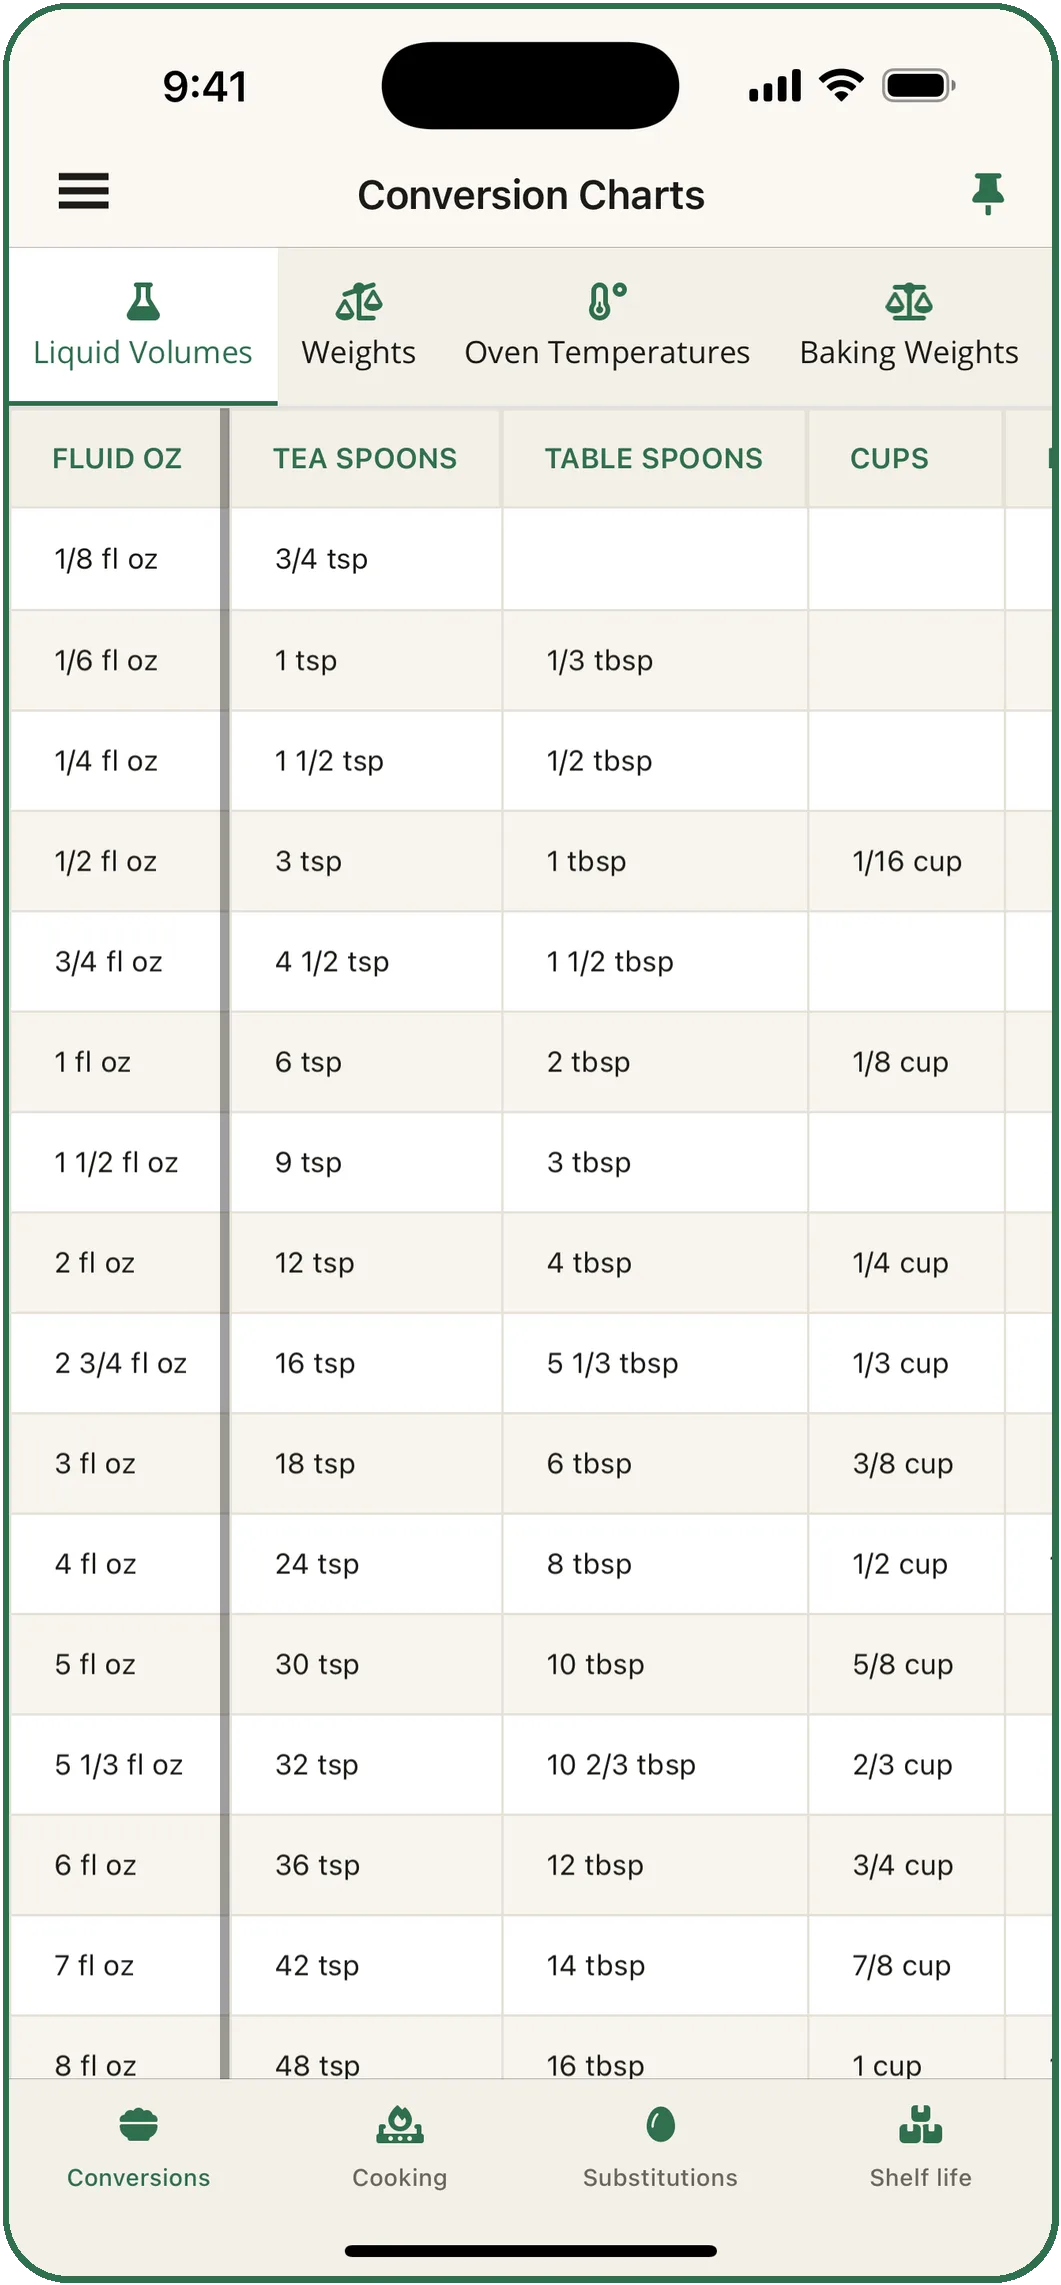
Cups to grams, ounces to milliliters, and back again.
Liquid volumes · Weights · Oven temperatures · Baking weights · Pan sizes
What a cup actually weighs
Ingredient by ingredient, because a cup of flour and a cup of honey are nowhere near the same. The figures follow King Arthur Baking's published weights, the table most American recipes are written against.
| Ingredient | Per cup | Ounces |
|---|---|---|
| Flour, all-purpose | 120 g | 4.25 oz |
| Sugar, granulated | 200 g | 7 oz |
| Sugar, brown (packed) | 213 g | 7.5 oz |
| Butter | 227 g | 8 oz |
| Honey, syrup, molasses | 340 g | 12 oz |
| Cocoa powder | 85 g | 3 oz |
| Oats, rolled | 89 g | 3.1 oz |
| Water | 236 g | 8.3 oz |
Spoon flour into the cup and level it. Scooping packs in up to 20% more.
Oven temperatures in three scales
Fahrenheit, Celsius and gas mark, as the numbers a dial actually has. 350°F is 176.7°C, and every oven in the world is marked 180.
| Fahrenheit | Celsius | Gas |
|---|---|---|
| 325°F | 165°C | 3 |
| 350°F | 180°C | 4 |
| 375°F | 190°C | 5 |
| 400°F | 200°C | 6 |
| 425°F | 220°C | 7 |
| 450°F | 230°C | 8 |
Pans by what they hold
Volume is the only honest basis for a swap: two pans that hold the same amount take the same batter, and matching the width tells you nothing.
| Pan | Holds | Swap for |
|---|---|---|
| 8 in round | 6 cups / 1.4 l | 8x4 in loaf |
| 9 in round | 8 cups / 1.9 l | 8 in square, 9x5 in loaf |
| 9x13 in rectangle | 14 - 15 cups / 3.4 l | Two 9 in rounds |
| 9 in springform | 10 cups / 2.4 l | 9 in square |
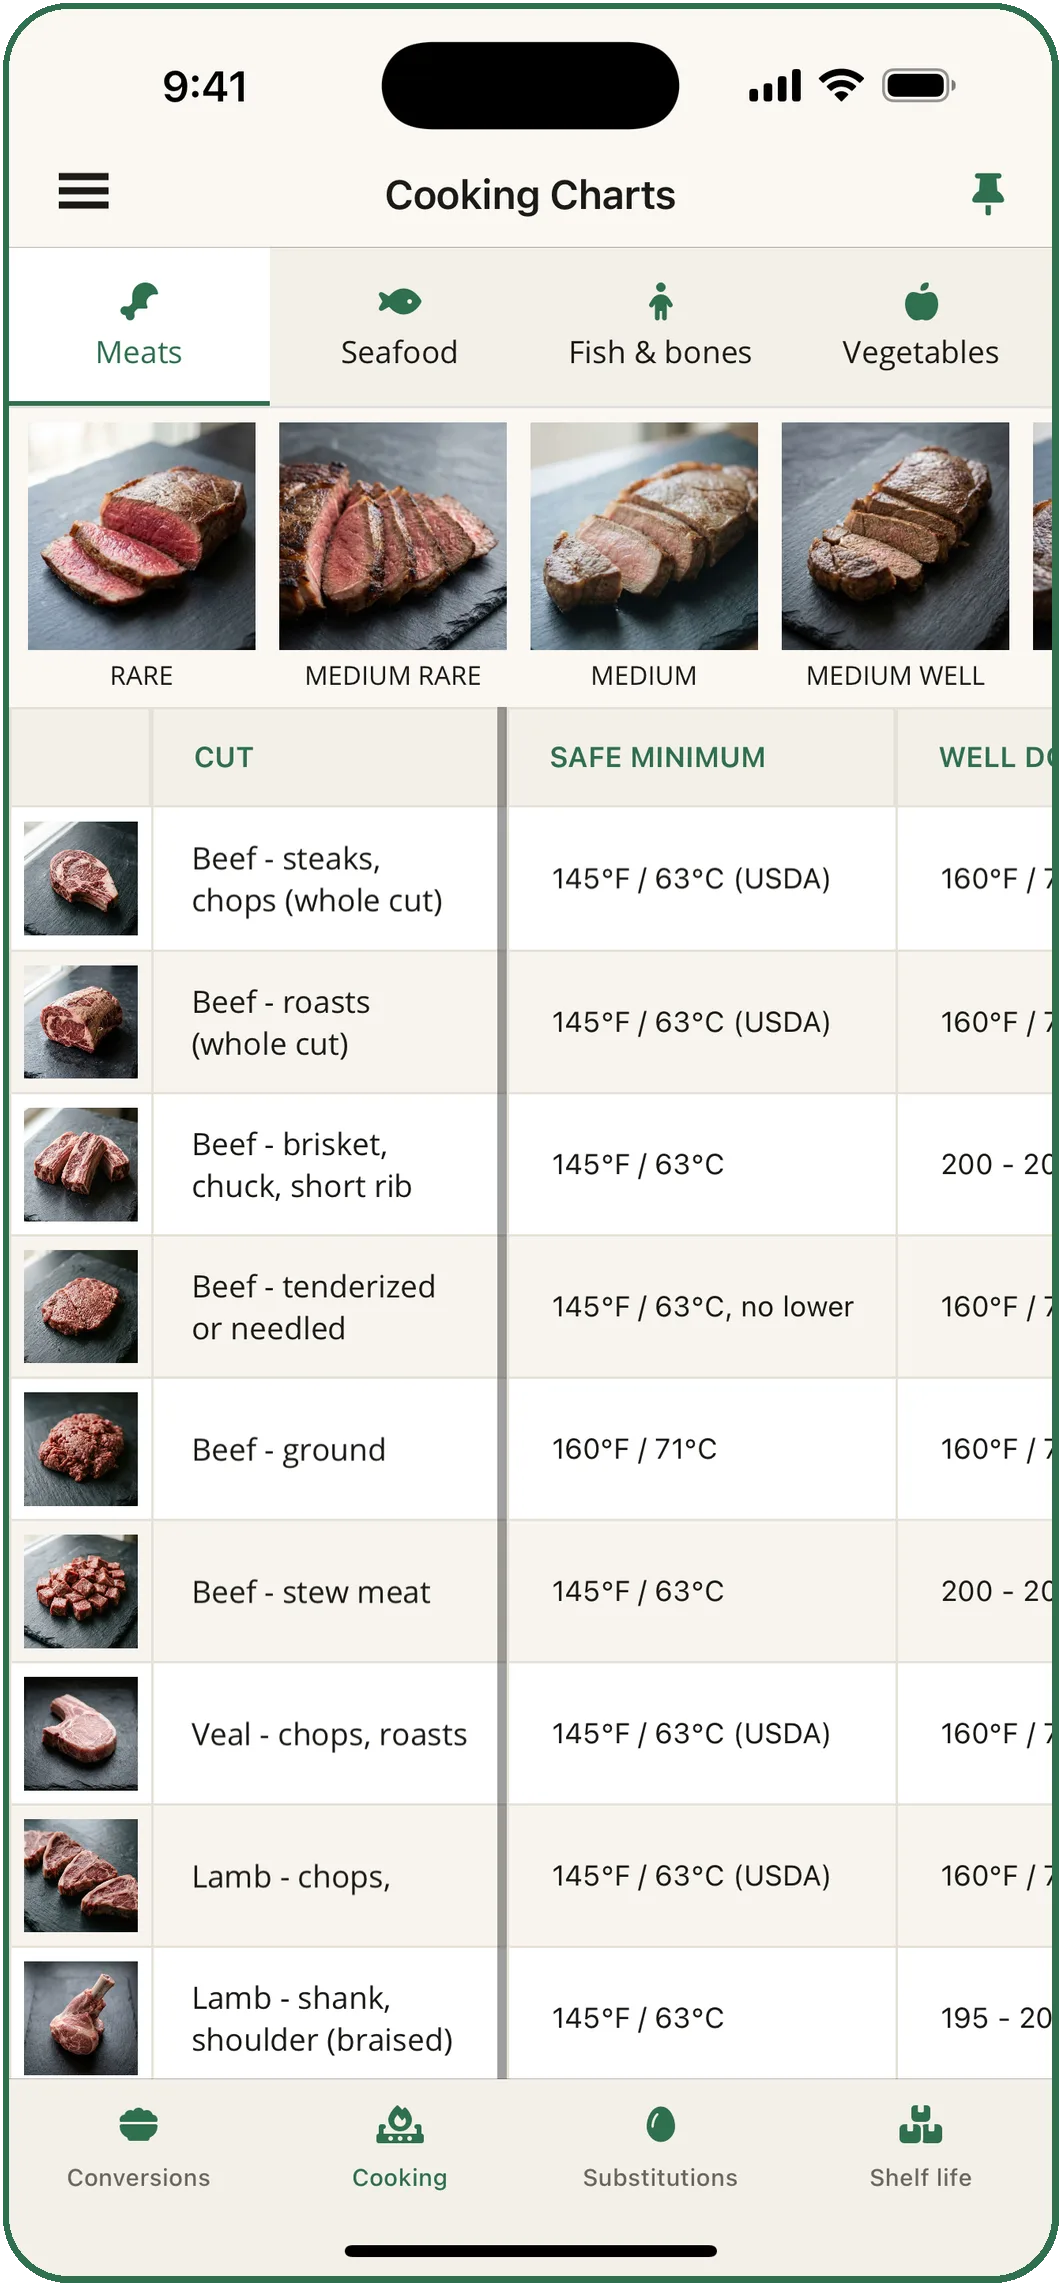
Safe temperatures for every cut, and what done looks like.
Meats · Seafood · Fish & bones · Vegetables
Safe internal temperatures with the distinction that matters spelled out: a whole steak and ground beef are not the same number, and blade-tenderized beef is a third. Resting times, where to put the thermometer, and photographs of meat at every stage of doneness. Vegetables and seafood come with what "done" actually looks like, and a chart sorts fish by their bones, which matters when you are cooking for children.
| Steak, whole cut | Inside temperature |
|---|---|
| Rare | 120 - 125°F / 49 - 52°C |
| Medium rare | 130 - 135°F / 54 - 57°C |
| Medium | 140 - 145°F / 60 - 63°C |
| Medium well | 150 - 155°F / 66 - 68°C |
| Well done | 160°F / 71°C and up |
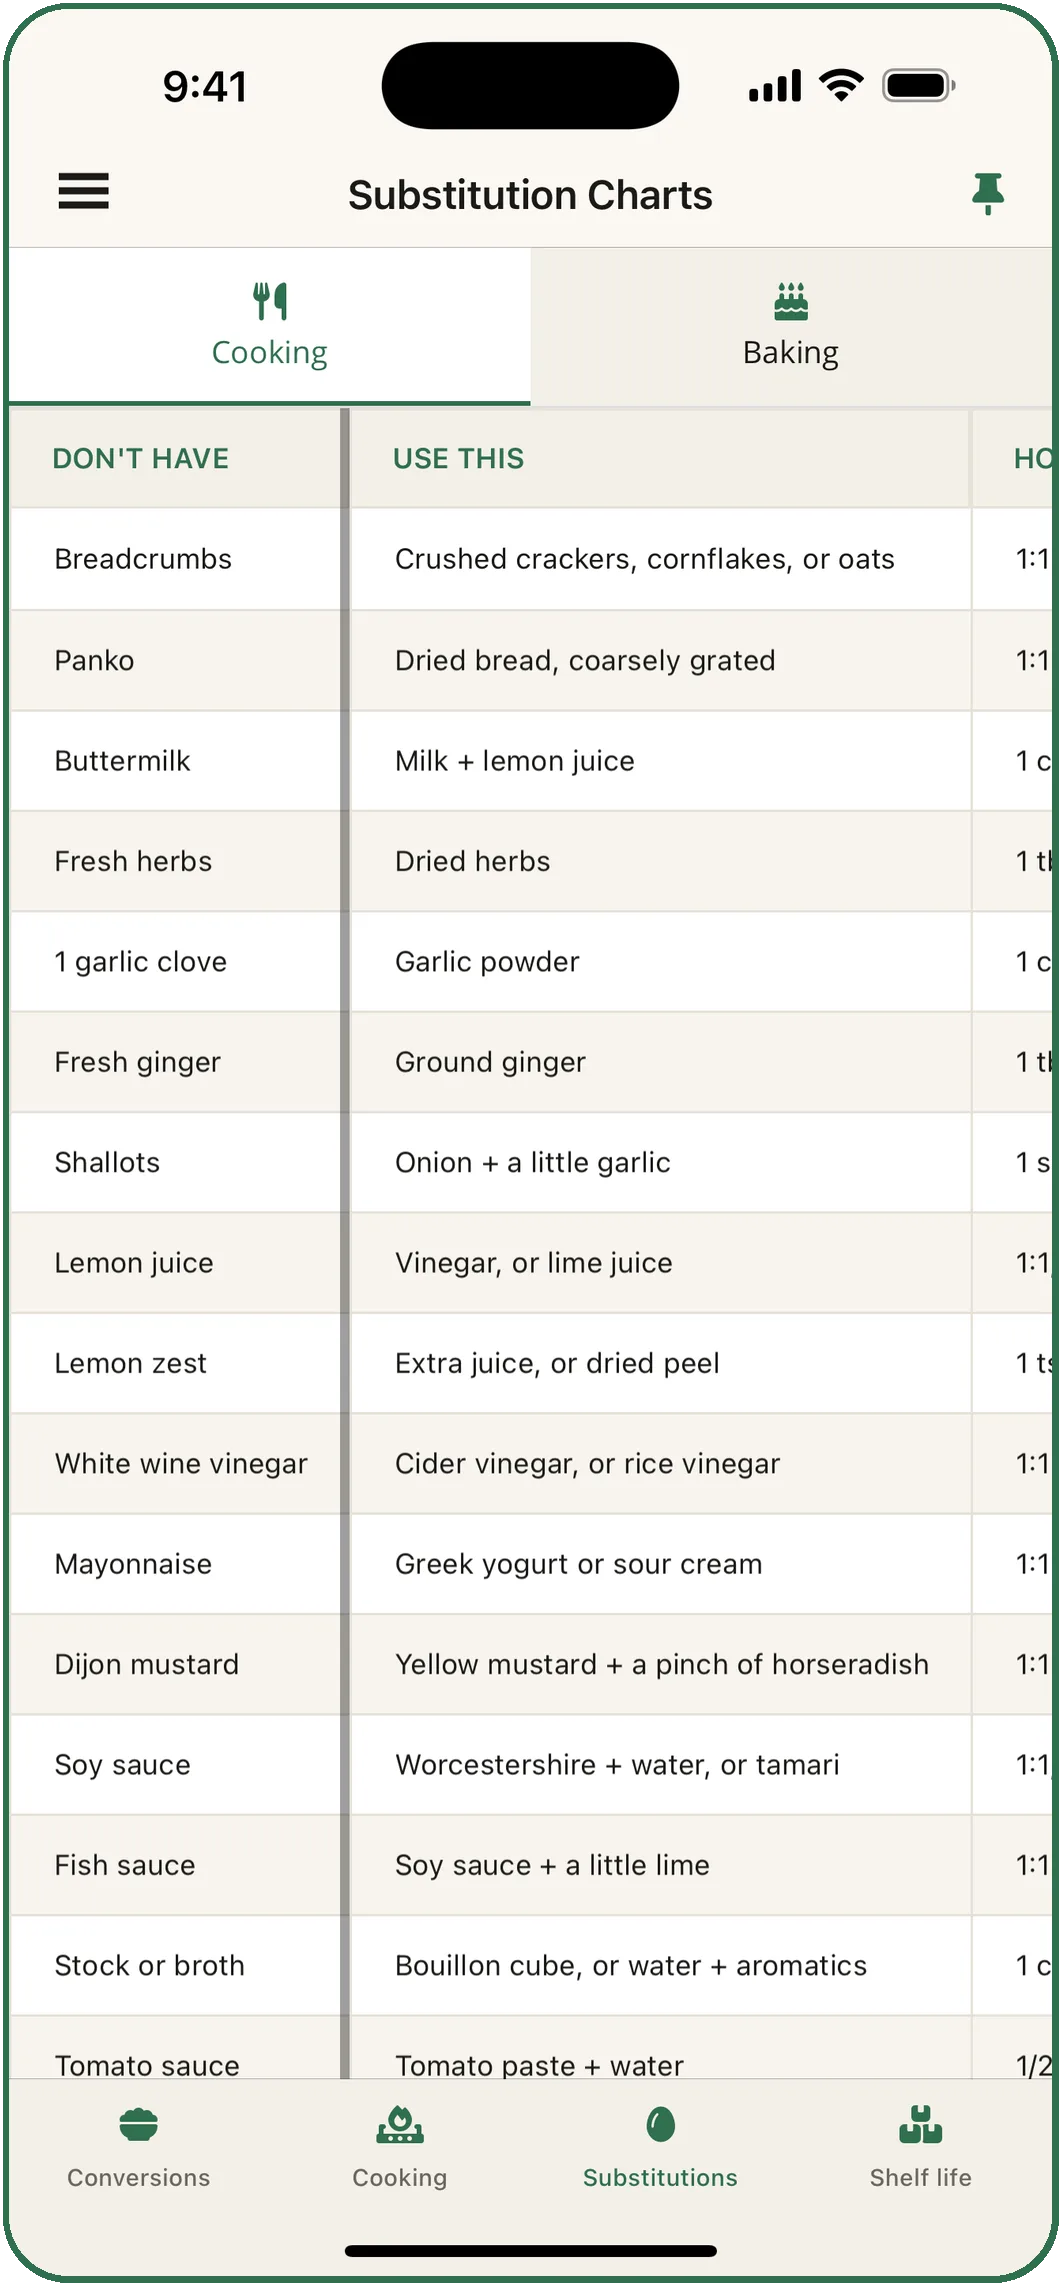
Swaps that admit their limits.
Cooking · Baking
Every swap comes with the amount and with the recipes it will not work in. Oil for butter is fine in a quick bread and wrong in pastry, and the chart says so.
| Don't have | Use this | How much | Not for |
|---|---|---|---|
| Butter | Oil | 1 cup butter = 3/4 cup oil | Anything creamed, or pastry - you need the solid fat |
| Buttermilk | Milk + lemon juice or vinegar | 1 cup milk + 1 tbsp acid, stand 5 min | Nothing much - this one is a genuine replacement |
| Fresh herbs | Dried herbs | 1 tbsp fresh = 1 tsp dried | Garnish, or anything raw. Dried basil in a salad tastes of dust |
| Cornstarch | Flour | 1 tbsp cornstarch = 2 tbsp flour | Clear glazes and pie fillings - flour clouds them |
| 1 egg | Ground flaxseed + water | 1 tbsp flax + 3 tbsp water, stand 5 min | Meringue, custard, or anything egg-leavened |
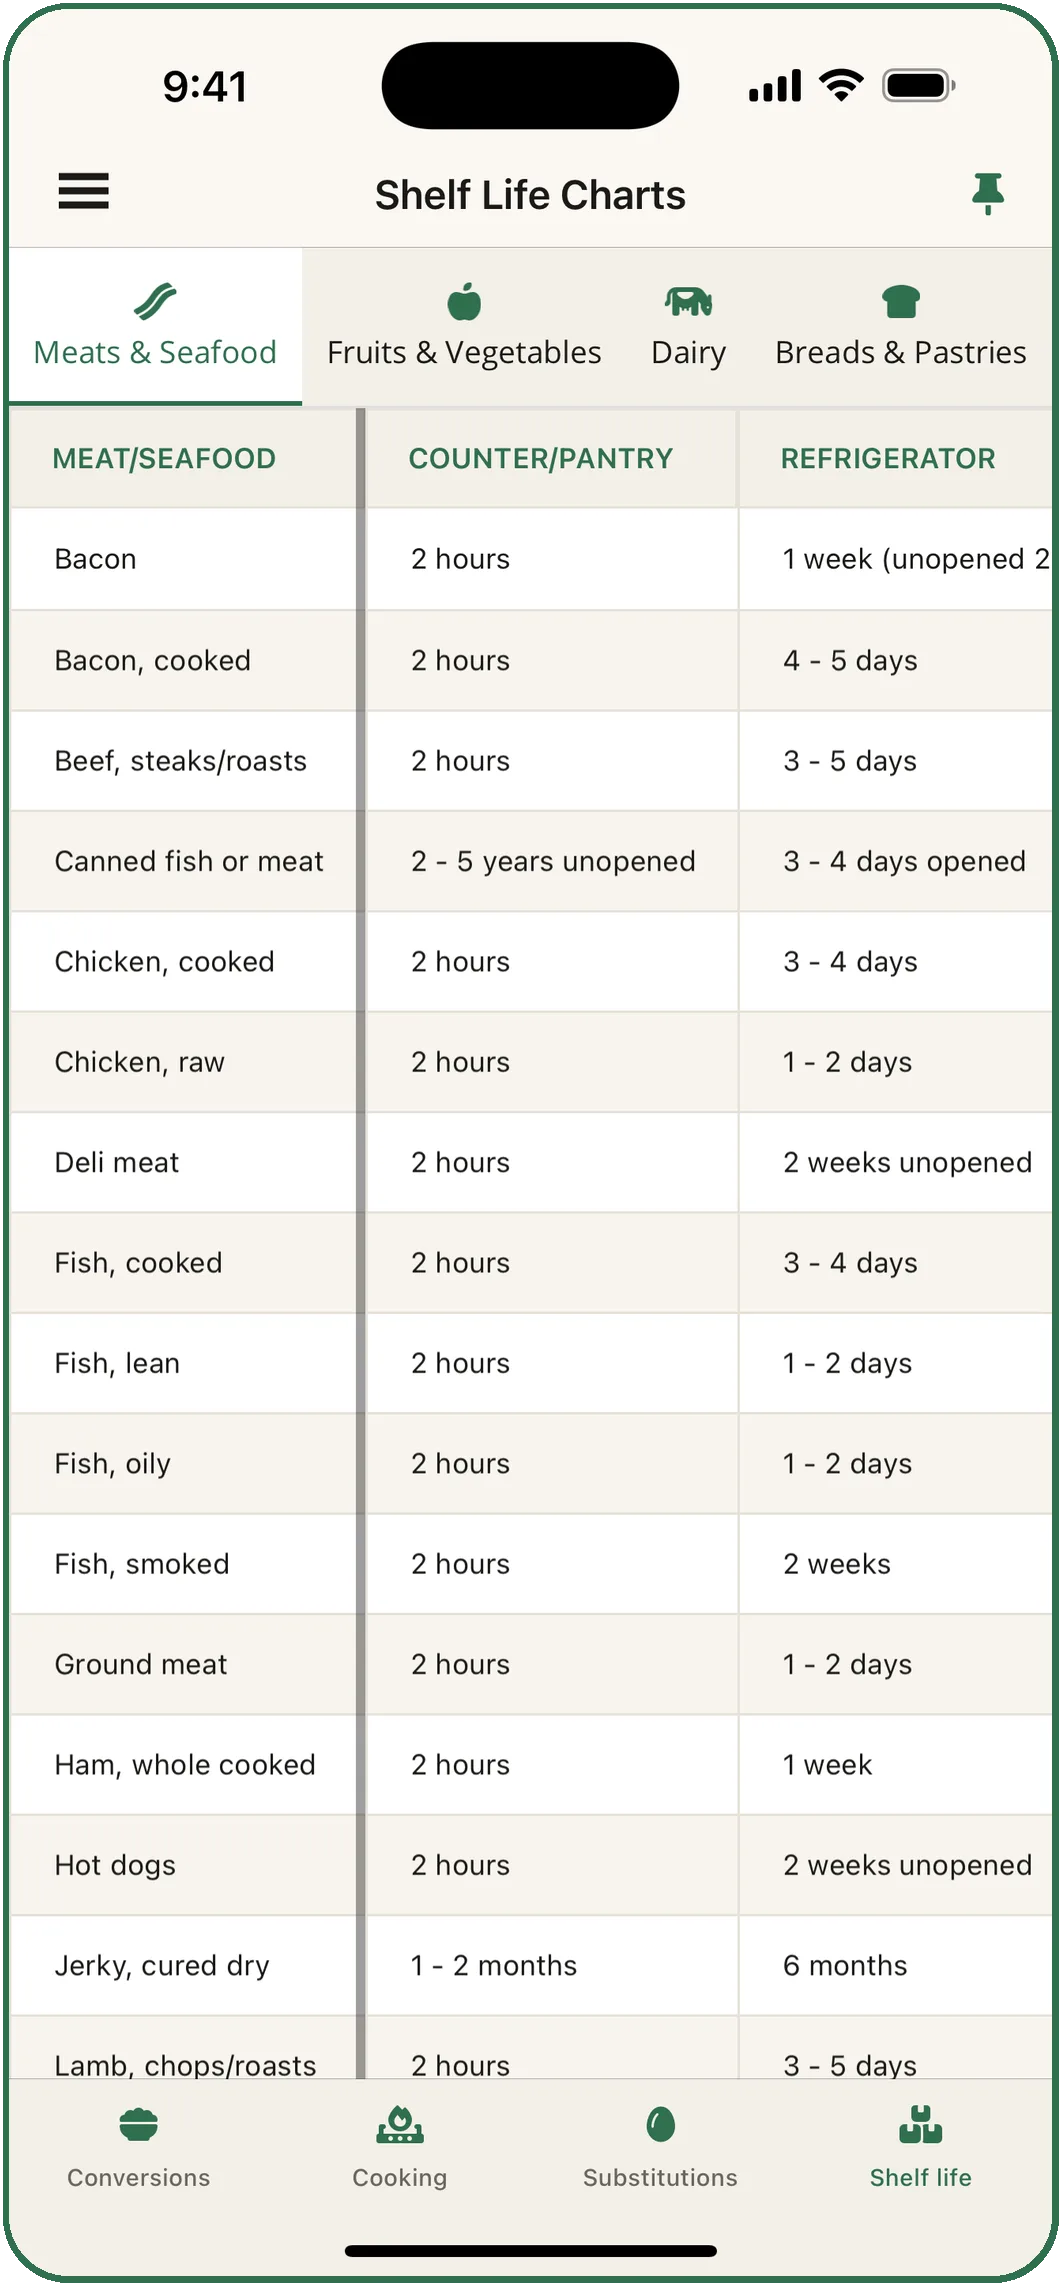
How long food keeps, and how much opening it changes.
Meats & seafood · Fruits & vegetables · Dairy · Breads & pastries
On the counter, in the fridge and in the freezer, and how much of that changes the moment the packet is opened. The notes say why: the fridge stales bread faster than the counter, and potatoes do not belong in it at all.
| Food | Counter | Fridge | Freezer | Opened |
|---|---|---|---|---|
| Chicken, raw | 2 hours | 1 - 2 days | 9 - 12 months | · |
| Deli meat | 2 hours | 2 weeks unopened | 1 - 2 months | 3 - 5 days |
| Cheese, hard | 4 hours | 3 - 6 months | 6 months | 3 - 4 weeks |
| Tomatoes | 3 - 5 days | Kills the flavour | 2 months whole | · |
| Bread, store-bought | 5 - 7 days | 1 - 2 weeks | 3 months | · |
The charts live in the app, so they work in a basement kitchen, a cabin or a plane.
Put any chart, or a single tab of one, on the Home Screen as a widget or on the app icon's press-and-hold menu. Widgets and shortcuts
Every chart reads in English, German, French, Spanish and Italian, units included.
The charts are guidance, not a food-safety authority. Cooking temperatures and times vary with equipment, altitude and the size of the food: use a food thermometer and follow your local food-safety guidance. See the Terms of Use.

Every chart is free.
No account, no limit and no ads. Download the app and the charts are there, offline, from the first launch.